

GPUSight - Find Rendering & Shader Performance Bottlenecks
7wolves
$19.25
$38.50
50%OFF
(no ratings)
Jump AssetStore
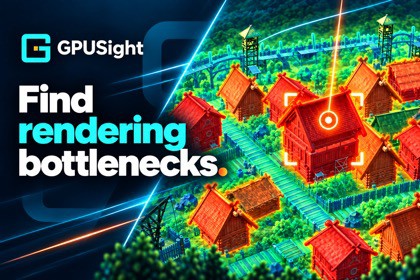
Stop guessing what to optimize. Find rendering bottlenecks in Unity with scene maps, grouped workload, object and shader research, material benchmarks, frame timing, built-in profiles and snapshots.Stop guessing what to optimize.GPUSight helps Unity developers find rendering hotspots, understand the evidence behind them, and check whether an optimization changed the workload.SEE THE BIG PICTURE• Find areas worth investigating directly in Scene View with visual workload maps.• Explore geometry workload, coverage, opaque and transparent overdraw, transparency, available shader passes, shadow-casting settings, shader features and texture resources.• Switch between maps to investigate different aspects of the same scene, then follow the findings into individual objects and materials.• Start with an overview of available GPU-pressure and workload signals.BREAK DOWN THE WORKLOAD• Group and filter contributors by material, shader, pass, camera, scene, layer, tag or prefab.• Identify heavy groups, then inspect the contributing objects, geometry, materials, shaders and textures.• Navigate from a contributor to its scene selection, Inspector and material research.INVESTIGATE GEOMETRY AND LODS• Use LOD coverage maps to find objects without LODGroups and inspect the levels available across your scene.• Explore estimated LOD levels and triangle reduction between levels to spot transitions that deserve attention.• Inspect an object’s geometry and LOD configuration alongside its contribution to the workload.INSPECT TEXTURES AND TEXEL DENSITY• Explore texel-density, mip-demand and texel-outlier maps to find texture-density differences in the current view.• Use a visual texel grid to compare texture scale across surfaces.• Inspect material texture bindings, dimensions and available resource-allocation data.RESEARCH SHADERS AND VARIANTS• Review material settings and static shader-source indicators for texture sampling, math, loops, branches and vertex processing.• Inspect selected shader variants and explore function-level source metrics.• Compare variant configurations to understand how keywords and other settings change the source-analysis results.BENCHMARK AND COMPARE MATERIALS• Run controlled material and shader benchmarks with their test conditions visible.• Compare material configurations A/B and review both configuration differences and measured preview timings.• Test how preview timings change with resolution, draw count and geometry.• Keep a baseline and export benchmark reports for later review.MEASURE FRAME TIMES AND SPIKES• Record available CPU and GPU frame timings in Play Mode and inspect slow frames.• Review frame-time history, spike markers and P95/P99 statistics to investigate performance stability.• Set budgets with built-in or custom performance profiles and check timing results against your targets.SAVE, COMPARE AND SHARE• Save snapshots of the available analysis results and their context.• Compare compatible results before and after an optimization.• Export and import snapshot JSON to preserve findings and share them with your team.For solo developers, technical artists and game teams, from a first performance pass to deeper rendering investigation.Learn more about GPUSightJoin our DiscordDocumentationREQUIREMENTS• Unity 2022.3 or newer.• Built-in / URP 14+ / HDRP 14+AI was used to create marketing images and to adapt the product for native plugins.