






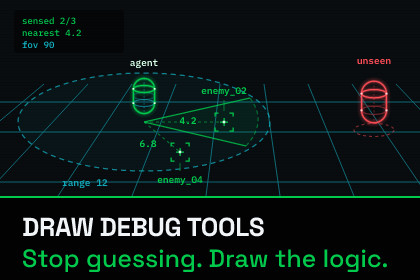
Stop guessing what your gameplay is doing. Draw shapes, labels and live graphs from your code and understand the behavior at a glance. No setup, and stripped from your release build.Draw Debug Tools gives you more than 21 functions covering shapes, 3D labels and live graphs, turning gameplay logic into something you can see and understand. One static class, no setup, and the calls disappear from your release build.💠 DrawDebugTools.DrawSphere(target, 0.5f, 16, Color.red);That one line puts a red sphere in the world at the position your AI just chose. There is nothing to set up before it works. Every draw function is static, so you can call it from Update, from a coroutine, from an event handler, or from anywhere else in your project where you need to see something.Most gameplay bugs are spatial. An enemy walks to the wrong position, a raycast misses a collider it should have hit, an agent takes a path that makes no sense. A log can print you the coordinates involved, but it cannot show you that the target is behind a wall, or that the ray stopped just short of the thing you aimed it at. Draw the values instead of printing them and the problem is usually obvious in a single frame.DRAW THE SHAPES TO SEE YOUR GAMEPLAYThere are 30 draw functions covering the shapes you need while debugging: lines, points, spheres, boxes, capsules, cylinders, cones, directional arrows, circles, planes, grids, camera frustums, bounding boxes and 3D coordinate axes. Each one takes a colour, and an optional lifetime if you want the shape to stay on screen for a few seconds instead of a single frame.Some of them do more than draw a primitive:• DrawRaycastHit takes the RaycastHit you already have and draws the whole picture — the ray up to the impact, the point it hit, the surface normal, the distance written along the ray, the collider it found and that collider's bounds.• DrawObjectColliders draws every collider on a GameObject and its children at their real world size and position. This is how you find the collider that is twice the size of the mesh it belongs to.• DrawDistance measures between two points and draws the number on the line.WATCH A VARIABLE CHANGE OVER TIME💠 DrawDebugTools.DrawFloatGraph("speed", speed);Call that once per frame with any float and you get a graph on screen that shows you the value as it changes and rescales itself to whatever range the value turns out to use. Give each graph its own name and you can watch several of them side by side.This is for the bugs where a value is only wrong for a few frames. Speed that spikes when the character lands, stamina that drains faster than it should, a dot product that changes sign when you did not expect it to. You see the shape of the curve and the moment it goes wrong, while the game is still running.PUT LABELS ON THINGS IN THE WORLD💠 DrawDebugTools.DrawString3D(enemy.position, stateName, TextAnchor.MiddleCenter, Color.yellow);This draws text at a position in the scene, turned to face the camera. You can put a state machine's current state above the enemy that is in it, a pathfinding cost above the node it belongs to, or an index above each waypoint in a list. Reading a value off the object it describes is much faster than matching object names in a console that is still scrolling.For values that have no position in the world, there is a screen-space log:💠 DrawDebugTools.Log("phase: " + phase, 2f);The second argument is how long the message stays up, so it does not disappear before ou have read it.FREEZE TIME AND FLY THROUGH THE FRAMEPress F9 and the game stops. The view detaches from your game camera and you can fly anywhere in the scene while the frame stays exactly as it was.Everything you drew is still on screen, so you can get behind it, above it or inside it and look at the geometry from an angle your game camera would never give you. A panel follows your crosshair and shows you what is under it: the hit point, the surface normal, the distance, the triangle index, the texture coordinates, the name of the object and the list of materials on its renderer. You can also slow time down, speed it up, pause and resume, to watch a fast interaction happen slowly.You move with the usual WASD, plus Q and E for down and up, and the mouse wheel changes how fast you fly. Every key here can be changed in the settings asset.LEAVE YOUR DEBUG CODE IN THE PROJECTDebug drawing is normally throwaway work. You write it to answer one question, you look at the answer, and you delete it. Three months later the same question comes back and you write the same code a second time.You do not have to do that here. Every DDT call is removed from your release build automatically, along with its arguments. You do not wrap anything in #if, you do not set a flag, and you do not have to remember to take anything out before you ship. The line below costs nothing at all in a release build — not even the work of building the string:💠 DrawDebugTools.Log("health: " + health);So you can leave your debug drawing where you wrote it. The next time you need that answer, the code that gives it to you is already in the file.IT DOES NOT SLOW YOUR GAME DOWNAll shapes drawn in a frame are batched into a single mesh and rendered in one draw call, so a thousand shapes cost one draw call, not a thousand. Drawing reuses its buffers instead of allocating, so it does not build up work for the garbage collector to do a few seconds later.That matters because debug drawing is often how you investigate a performance problem in the first place. If the tool caused frame drops of its own, you would not be able to tell which stutter was the game's and which was the tool's.DOCUMENTATIONGuides, the full API reference and the changelog:https://ddt.qinteract.comWHAT IS IN THE PACKAGEFull C# source code, so you can read exactly what any function does and change it if you want to. Works with the old Input Manager, the new Input System, or a project that has both installed. The shaders ship inside the package, so your shapes render correctly in a build without you configuring anything. A settings asset collects the keys, colors, graph sample count and agent path options in one place.• 30 draw functions — lines, points, spheres, boxes, capsules, cylinders, cones, arrows, circles, planes, grids, frustums, bounds and 3D coordinate axes.• Live float graphs — one call per frame plots a value over time and scales itself.• Debug camera — freeze time, detach, fly through the frame, inspect what is under the crosshair, and speed up, slow down, pause or resume time.• World-space labels — pin a value to the object it describes, facing the camera.• On-screen log — messages with a lifetime, readable while the game is still moving.• Visualize a RaycastHit properly — hit point, normal, distance, collider and its bounds.• Measure a distance between two points, drawn with the number on the line.• Draw every collider on an object and its children, at true world size.• AI agent paths — one component draws a NavMeshAgent's route and remaining distance.• Billboards — pin an icon or texture to a position, always facing the camera.• Optional lifetime on every shape, so it stays on screen for as long as you need it.• No setup: no prefab, no manager, no scene preparation.• Batched rendering: all drawn shapes in a frame go out in one draw call, and drawing reuses its buffers instead of allocating.• Removed from release builds automatically — calls and arguments both, no #if of your own.• Settings asset for input keys, colors, graph sample count and agent path options.• Old Input Manager, new Input System, or both.• Full C# source included.Draw Debug Tools has been developed and maintained by me since its first release. For 3.0 I used an AI coding assistant to help implement the changes I planned and to find bugs, I reviewed and edited every change before it went in. The design and the public API stayed under my control, and the result was tested by hand before submission.