


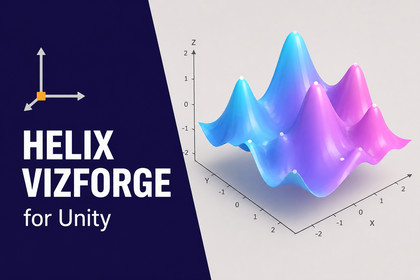
Helix Vizforge - Charts, Dashboards & Data Visualization
Szekeres
$39.99
$79.99
50%OFF
(no ratings)
Jump AssetStore
Build interactive 2D/3D charts, graphs and dashboards in Unity from one data pipeline. Includes UGUI, UI Toolkit, world-space, financial charts, telemetry, CSV/JSON, export and WebGL.Build interactive charts, graphs, dashboards, financial panels, scientific plots, telemetry overlays and world-space data visualizations without stitching together separate chart systems.Helix Vizforge is a complete charting and data-visualization framework for Unity. It combines 28 core 2D chart generators, financial and scientific analysis, dashboards, live telemetry and procedural 3D charts with one typed data model and one rendering pipeline.Use the same Dataset, scales, themes and interactions for a line chart on a Canvas HUD, a candlestick panel in a trading simulation, a live FPS graph, a cross-filtered analytics dashboard or a 3D surface plot placed directly in your scene.Online WebGL Demo | Online DocumentationTry it before you buy it.The interactive WebGL showcase is built from the actual asset. Its seventeen hands-on modules let you:• Switch between chart types• Change themes at runtime• Stream live telemetry• Cross-filter a dashboard• Pan and zoom with real hit testing• Export a PNG report• Load your own CSV through the browser's file pickerNothing in the showcase is mocked. Every module uses the public API included in the package.One charting pipeline, three rendering backendsA chart is converted into a backend-neutral DrawList, then submitted to any of three render surfaces:• UGUI — UGuiChartSurface, implemented as a MaskableGraphic, for Canvas HUDs, menus and application panels.• UI Toolkit — VizforgeChartElement, rendered through generateVisualContent and MeshGenerationContext, with geometry chunking for the 16-bit mesh-index limit.• World-space and 3D — WorldSpaceChartSurface, using procedural MeshFilter and MeshRenderer output for in-scene visualizations and 3D chart meshes.You do not need separate datasets or chart definitions for each UI system. The Render Backends demo module draws one chart through all three backends at the same time from a single geometry pass.Charts and graphsHelix Vizforge includes 28 core 2D chart generators:• Line, area, spline, step and sparkline charts• Scatter plots• Vertical and horizontal bar charts• Stacked and grouped bars• Waterfall and funnel charts• Pie and donut charts• Radar and polar charts• Sunburst charts• Histograms• Box plots and violin plots• Heatmaps• Gauges and progress indicators• Parallel-coordinates plots• Treemaps and Sankey diagrams• Timeline and Gantt chartsA dedicated procedural-mesh path adds:• 3D bar charts• 3D scatter plots• 3D surface plotsFinancial visualizationCreate financial and trading interfaces with:• Candlestick and OHLC charts• Volume views• Simple and exponential moving averages• Bollinger bands• RSI• MACDAll indicators are calculated inside the package.Scientific analysisThe package includes:• Linear, polynomial, exponential, power and logarithmic least-squares fitting• Live R² results• Moving-average smoothing• Savitzky-Golay smoothing• FFT power spectra• Marching-squares contour generation• Confidence bands and error bars• K-means clustering• Linear and exponential forecasting• Descriptive statistical summariesDashboards and business intelligenceBuild multi-panel dashboards with chart and label widgets arranged in serializable grid layouts.Dashboard features include:• Layout serialization to JSON• Cross-filtering• Pivot tables• KPI scorecards• Hierarchical drill-down• Funnel analysis• Cohort-retention analysisCross-filtering is applied through GeometryContext.RowFilter, so excluded rows are removed before tessellation instead of being drawn and hidden afterward.Live telemetry and runtime graphsA fixed-capacity ring-buffer TimeSeries and TelemetryHub support continuously updating charts without unbounded data growth.Included telemetry sources cover:• FPS• Frame time• Managed memoryYou can add custom sources through ITelemetrySource, define threshold alerts and display incoming samples with the live-line generator.Data import, transformation and reuseThe typed columnar Dataset / DataSeries model supports:• Number• Time• Category• Boolean• Text• Color• Vector3Create data through inline builders or reusable DatasetAsset files, import and export CSV or JSON, or load remote text through UnityWebRequest.Built-in transformations include:• Filter• Sort• Map• Bin• Aggregate• JoinAvailable aggregate operations include Sum, Mean, Min, Max, Count, Median, First and Last.The CSV importer supports headers, type inference, quoted fields, embedded delimiters, embedded newlines, escaped quotes, ragged rows, CRLF and LF line endings, blank trailing lines and delimiter auto-detection.Scales, axes and themesIncluded scale types:• Linear• Logarithmic• Symmetric logarithmic• Time• Band/categoryEach scale drives its own automatic tick formatting.Six included theme presets provide:• Dark• Light• Scientific• Financial• High contrast• Color-blind-safe, Okabe-Ito-style colorsThe theming showcase includes a live WCAG contrast readout, and themes can be changed while the application is running.InteractionThe shared chart pipeline supports runtime interaction across the rendering backends, including:• Pan and zoom• Real hit testing• Dashboard cross-filtering• Hierarchical drill-downBecause interaction operates against the shared data and geometry model, it does not need to be rebuilt separately for each individual chart type.Export and reportingExport data and visualizations as:• CSV• JSON• SVG• PNGSVG export produces true vector output.PNG output is rasterized entirely on the CPU, without GPU readback, so it can run in headless CI environments. ReportComposer can combine multiple panels into one titled report.Editor workflowThe package includes:• Chart Wizard editor window• Custom inspector for ChartView• Custom inspector for DatasetAsset• Custom inspector for ThemeAsset• Assets/Create menu entries• GameObject creation menu• Sample-scene generator• Asmdef lint and compile-check helpers for CIBoth inspector-driven and scripting workflows are supported. The included documentation covers a no-code setup path as well as the full public API.Evidence you can run yourselfApproximately 470 automated tests are included across edit-mode, editor and play-mode assemblies. They run locally in Unity's Test Runner.The last recorded full batchmode run completed with:• 451/451 edit-mode tests passing• 14/14 play-mode tests passing• Zero compile errors• Clean assembly-definition lintPublished performance floorTests/EditMode/PerformanceTests.cs measures the backend-neutral CPU pipeline that converts source data into a DrawList.Generation scales linearly with point count, and a dedicated regression test guards against super-linear behavior.The published measurements were deliberately taken in Editor batchmode under Mono, using -nographics and without release optimization. They are presented as a conservative performance floor and regression guard rather than an optimized best-case benchmark.No third-party runtime libraries or native binariesThe package does not require:• Newtonsoft JSON• External mathematics libraries• Native plugins• DLLs• P/Invoke• External web services• API keysThe JSON parser, CSV parser, FFT, curve fitting, clustering, technical indicators and CPU PNG rasterizer are implemented in the package in managed C#.That managed implementation is also what allows the interactive demo to build to WebGL.Verified buildsThe following configurations have been built and verified:• Unity 6000.0.62f1 on Windows• Interactive WebGL demoThe code is platform-agnostic managed C#, but platforms not listed above have not been built on the development machine and are therefore not claimed as verified.Known limitationsStated up front, because discovering them after purchase is worse.• UGUI vertex ceiling. A single UGUI mesh is limited to roughly 65,000 vertices, corresponding to approximately 16,000 line points in a typical line chart. For larger geometry, use the UI Toolkit or world-space backends, which chunk their output.• GPU-dependent showcase modules. The 3D charts and UI Toolkit render-backend pane use RenderTexture output. They compile and run under headless -nographics, but cannot produce captured pixels without a GPU.• PNG-export text. CPU PNG export uses a compact built-in 5×7 bitmap font. KPI and pivot labels can become crowded at small sizes. Use SVG export when crisp, scalable text is required.• Render pipelines. URP and the Built-in Render Pipeline are supported. URP is recommended for world-space charts, with documented Built-in material fallbacks. HDRP has not been tested and is not claimed.• No Burst or Jobs acceleration. The package reserves an assembly for future acceleration work, but the shipped code path is entirely managed. The published performance measurements represent the actual shipped path.• Verified platforms. Windows with Unity 6000.0.62f1 and WebGL are the verified targets. Other platforms have not been built on the development machine.RequirementsUnity 6000.0 or newer.UGUI is used for the default Canvas workflow. UI Toolkit and world-space rendering are alternative backends.URP is recommended for world-space charts. The project references URP 17.0.4.The Input System package is used by the interactive demo, which creates its own input module at runtime.Samples and documentationIncluded content:• Twelve sample scenes• One seventeen-module interactive showcase scene• A single searchable HTML manualThe manual covers installation, quick starts, the complete chart catalog, all rendering backends, scales, datasets, themes, the no-code workflow, scientific and financial analysis, dashboards and BI, telemetry, export, the scripting API, troubleshooting and frequently asked questions.Supportszekipapa77@gmail.comRendering backends• UGUI: UGuiChartSurface, implemented as a MaskableGraphic• UI Toolkit: VizforgeChartElement, using generateVisualContent and MeshGenerationContext• UI Toolkit geometry is chunked to remain within the 16-bit index limit• World-space: WorldSpaceChartSurface, using procedural meshes and SubmitMesh3D• World-space rendering prefers a URP unlit material• Built-in-compatible unlit/default shader fallbacks are included• Backend-neutral pipeline: data → scales → encoding → CPU tessellation → DrawList → render surfaceChart and graph generators• Cartesian and line: Line, Area, Spline, Step, Sparkline, Scatter• Bar and comparison: Bar, Horizontal Bar, Stacked, Grouped, Waterfall, Funnel• Radial: Pie, Donut, Radar, Polar, Sunburst• Statistical and indicator: Histogram, Box Plot, Violin, Heatmap, Gauge, Progress• Relational, hierarchical and temporal: Parallel Coordinates, Treemap, Sankey, Timeline, Gantt• Financial: Candlestick, OHLC, Volume• Scientific: Regression, Error Bar, Confidence Band, Contour• Telemetry: Live Line• 3D: Bar3D, Scatter3D and Surface3D through Chart3DGeneratorBase and procedural Mesh3DData model and import• Typed fields: Number, Time, Category, Boolean, Text, Color, Vector3• Runtime Dataset and DataSeries model• Reusable DatasetAsset authoring• Inline data builders• CSV import and export• JSON import and export• Remote text loading through a UnityWebRequest coroutine• CSV support: headers, type inference, quoted fields, embedded delimiters and newlines, escaped quotes, ragged rows, CRLF/LF, blank trailing lines and delimiter auto-detection• JSON importer supports flat record arrays and defensive filling of missing numeric valuesData transformations• Filter• Sort• Map• Bin• Aggregate• Join• Aggregates: Sum, Mean, Min, Max, Count, Median, First, LastScales and themes• Linear scale• Log scale• Symmetric-log scale• Time scale• Band/category scale• Automatic tick formatters• Six theme presets: dark, light, scientific, financial, high contrast and color-blind-safe• Runtime theme switching• Live WCAG contrast readout in the theming showcaseScientific and statistical analysis• Linear regression• Polynomial regression• Exponential fitting• Power fitting• Logarithmic fitting• Live R²• Moving-average smoothing• Savitzky-Golay smoothing• FFT power spectrum• Marching-squares ContourGenerator• ConfidenceBandGenerator• ErrorBarGenerator• Lloyd's-algorithm KMeans• Linear and exponential Forecasting• Retention analysis• Histograms• Descriptive summariesFinancial analysis• SmaIndicator• EmaIndicator• BollingerBands• RsiIndicator• MacdIndicator• Candlestick, OHLC and volume visualizationDashboards and business intelligence• Dashboard grid with rows, columns, gaps and tile spans• Chart and label widgets• Dashboard-layout JSON round trip• Cross-filtering through CrossFilter and CrossFilterEngine• Filtering enters the geometry pipeline through GeometryContext.RowFilter• PivotEngine• KpiCalc and KpiWidget• DrillDownController• Funnel analysis• Cohort-retention analysisTelemetry• Fixed-capacity TimeSeries ring buffer• TelemetryHub• FpsSource• FrameTimeMsSource• ManagedMemorySource• Custom sources through ITelemetrySource• ThresholdAlert• LiveLineGeneratorExport and reports• CsvExporter• JsonExporter• VectorExporter for SVG• ImageExporter for CPU-rasterized PNG• ReportComposer• PNG generation requires no GPU readback and can operate in headless CIEditor tooling and samples• Window ▸ Helix Vizforge ▸ Chart Wizard• GameObject ▸ Helix Vizforge ▸ Chart (Line)• Assets ▸ Create ▸ Helix ▸ Dataset• Assets ▸ Create ▸ Helix ▸ Theme• ChartViewEditor• DatasetAssetEditor• ThemeAssetEditor• Window ▸ Helix Vizforge ▸ Generate Sample Scenes• Twelve sample scenes• HelixVizforge_InteractiveDemo with seventeen interactive modules• CI helpers: AsmdefLinter and CompileCheck• Single searchable HTML documentation fileArchitecture and extensibility• Package ID: com.helix.vizforge• Root namespace: Helix• Version: 1.0.0• 32 assembly definitions: 18 runtime, 6 editor, 2 sample, 3 demo and 3 test• Core types: Dataset, DataSeries, FieldType, DataPoint, DrawList, GeometryContext, IGeometryGenerator, IRenderSurface• Extensibility SDK• Registries for chart types, scales, transforms and palettes• Plugin discovery supportEngineering and compatibility• Approximately 470 automated tests included across edit-mode, editor and play-mode assemblies• Last recorded full run: 451/451 edit-mode and 14/14 play-mode tests passing• Published CPU-generation benchmark• Linear-scaling regression test• 100% managed C#• No third-party DLLs• No native plugins• No P/Invoke• No Newtonsoft JSON• Verified with Unity 6000.0.62f1 on Windows• Verified interactive WebGL build• Built-in Render Pipeline supported• URP supported and recommended for world-space visualization• HDRP untested and not claimed• No third-party content or attribution obligationsThis package was built with AI-assisted development tools. Primarily Claude Code for the C# implementation, with a smaller amount of assistance from GPT-based models via Codex. All generated code was reviewed, edited and integrated by hand rather than shipped as produced.The written documentation and store copy were drafted with AI assistance and edited by hand.