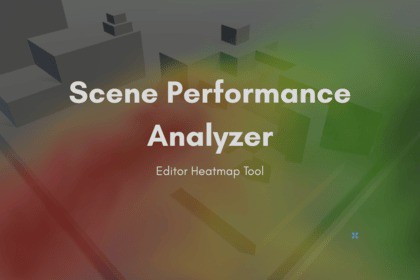
A real-time performance heatmap tool that helps you visualize and optimize rendering costs in scenes. Perfect for targeting high-performance environments, large open worlds, or VR projects.HDRP known issue (Editor-only): When the heatmap overlay is enabled, part of the Scene View toolbar/overlay may appear tinted by the heatmap color. This is visual-only; analyzer features and runtime builds are unaffected. Scope: HDRP Scene View (not URP/Built-in). Workaround: disable “Show Heatmap in Edit Mode”. Fix in progress.The Scene Performance Analyzer is an editor-only tool that visualizes the performance impact of every renderer in your scene. It estimates the GPU and CPU cost of objects using metrics such as triangle count, material complexity, and renderer state. This information is displayed in the form of a heatmap, helping you identify performance hotspots.Key Features:Instantly see which GameObjects are expensive to render using an in-editor color gradient overlay - Live Heatmap VisualizationCalculates approximate GPU/CPU impact based on mesh data, material count, and renderer complexity - Accurate Cost EstimationAdjust thresholds, colors, update frequency, and visibility settings through a dedicated window - Customizable SettingsEditor-only script that does not affect runtime builds or gameplay logic - Lightweight and SafeIdeal For:Developers working with large, open-world scenesArtists optimizing static or baked environmentsVR and mobile game developers with strict performance budgetsTeams aiming to catch render bottlenecks before profilingVery Easy SetupSimply install the package, add the ScenePerformanceAnalyzer script, and open the Scene Performance Analyzer window. The system starts tracking renderers and generating the heatmap on start.Supported Render PipelinesBuilt-in Render Pipeline (BRP)Universal Render Pipeline (URP)(Tested in 2021 LTS and newer. Heatmap appearance may vary slightly depending on RP shader support.) High Definition Render Pipeline (HDRP)System Requirements2021.3 LTS or newer recommendedEditor-only: does not affect buildsCompatible with Windows, macOS, and Linux editorsHow It WorksAutomatically collects all active Renderer components in the scene.Shader/material count per objectEstimates render cost based on:Vertex/triangle countMaterial and submesh complexityLightmap/static batching usageLOD usage (where applicable)Heatmap color is calculated per object using weighted scoring.Customization OptionsToggle heatmap visibility in Edit and Play modeAdjustable thresholds for low/medium/high impactColor settings for each heat levelUpdate rate control (live updates or on-demand)Object filters (e.g. hide low-impact objects)Editor IntegrationWindow > Tools > Performance AnalyzerPreferences integrated for toggling Edit Mode visibilityPerformance ImpactVery low editor overhead, updates in the background at controlled intervalsDesigned to scale with large scenesLimitationsRender cost is estimated, not profiled, values may not perfectly match real runtime profiling tools like the Profiler or Frame Debugger.Heatmap is a visualization tool, not a substitute for deep GPU profiling (but it will catch common bottlenecks early).AI tools were used for assistance with debugging, shader development in HDRP, and creation of the documentation.


